Ask any forex trader and they will tell you how important technical analysis is in the forex trading industry. Millions of dollars are traded on the basis of technical analysis, which is actually just about observing charts and graphs. Here, we will see how a small line or a bar can become the basis for traders to invest millions of dollars.
There are many types of forex charts, each having its own pros and cons as well as a few common features. Some of the numerous advantages of using forex charts are:
Easily Available
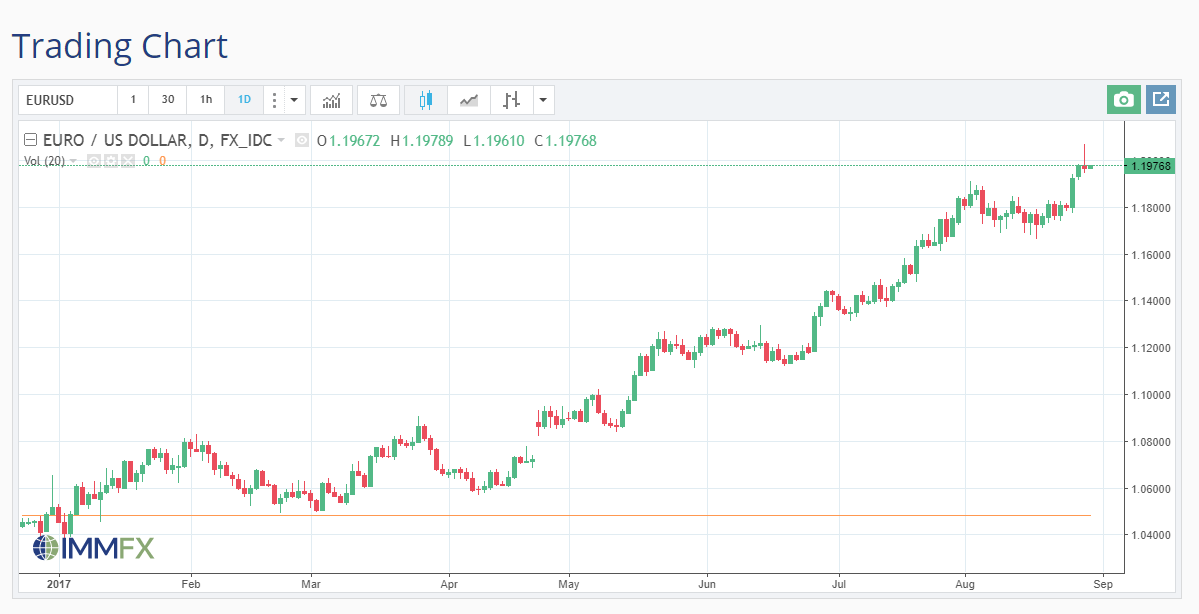
The first and most popular incentive for using forex trading charts is that they are available on the World Wide Web. Finding reliable and comprehensive forex charts on the internet is as easy as searching the definition of forex itself. And the best part is that a majority of these are available free of cost. This makes forex charts and technical analysis quick, efficient and cost effective. Get the IMMFX real time Trading Chart.
Available in Several Types
Another attractive feature of forex charts is that they are available in many types. Some of the popular forex charts include line graph, bar graph, and candle stick chart. In addition to these, the Heikin-Ashi chart and the Renko chart are used by several forex traders. Every chart has a different application. For example, you can use a line graph to observe the trend of a closing price of an asset over the past decade. By looking at the line graph, you can easily identify the ups and downs of a market.
Conveys Lots of Information
Forex charts provide a lot of information. From historical trends to the seasonal variations, the performance of the asset and the effect of economic and political factors on the market are all conveyed by forex charts.
Less Distortions
Technical analysis is mostly based on one variant and that is the price of the asset. The fact that this is the only dependent variable spares less room for nuisance variables. In short, forex charts summarize the past performance of a currency pair with almost no distortions. With the market price as the only variable, you can easily find out the other independent variables that affected the value of the currency during a specific time.
Bar Charts and Candle Stick
Bar charts and candle stick charts are very useful for arbitrage investors and short-term traders who trade for hours and even minutes. These graphs show the opening price, closing price, high and low value of the stock on a daily basis over the past few years. This makes it pretty easy to guess the time at which the market usually touches its high point.
Conclusion
Technical analysis is all about studying different types of charts. It has made forex trading less risky and more approachable. Even a new trader can predict the future direction of the market by looking at forex charts.